APPLE STOCK PLUMMETS: A Buying Opportunity or a Warning Sign? The tech giant’s shares have just suffered their biggest one-day drop since August, leaving investors wondering if this is a moment to buy or a sign of things to come. Apple’s stock price has been a darling of the market for years, but recent events have sparked concerns about the company’s valuation and the broader market’s momentum. In this article, we’ll delve into the details of Apple’s latest price drop and explore what it might mean for investors. Is this a buying opportunity, or a warning sign that the tech bubble is starting to burst? Let’s dig in and find out.
Apple’s Chart Analysis
Recent Price Action and Technicals

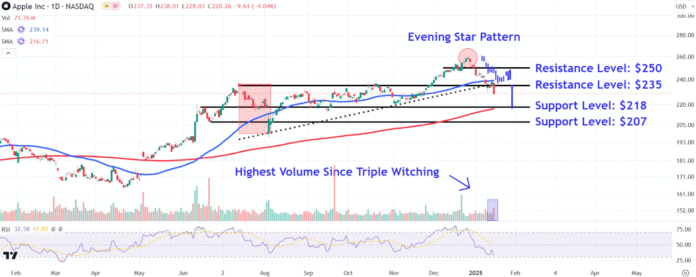
Apple shares will be in focus on Friday after recording their largest one-day drop since early August yesterday following news that the tech giant lost its position as China’s largest smartphone seller last year. The stock fell decisively below the lower trendline of an ascending triangle, raising the possibility of a significant breakdown.
Since an evening star pattern marked the stock’s all-time high (ATH) last month, Apple shares have trended sharply lower. Selling pressure intensified on Thursday, with the price falling decisively below the lower trendline of an ascending triangle, raising the possibility of a significant breakdown.
It’s also worth pointing out that the stock recorded its highest volume yesterday since December’s triple witching trading session, indicating that larger market players participated in the sell-off.
Key Support Levels to Watch
The first lower point of interest on the chart sits around $218. This location provides a confluence of support from a trendline that links a series of highs and lows from June to September with the upward sloping 200-day moving average.
This location also corresponds with a bars pattern projected downside target that takes the stock’s prior major correction from July to August last year and overlays it from last month’s record high.
The bulls’ inability to defend this level could see Apple shares revisit lower support at the $207 level. Investors may look for buying opportunities in this area near the June 2024 pullback low, which also closely aligns with several prices situated just above the August trough.
Important Resistance Levels to Monitor
Amid a recovery in the iPhone maker’s stock, investors should watch for a potential retest of the $235 level, a location where the shares may run into resistance near the ascending triangle’s lower trendline and prominent peaks that formed on the chart in July and October last year.
Finally, a move back above the ascending triangle’s top trendline could see Apple shares climb to around $250. Investors who have purchased the stock at lower prices may look to book profits in this region near a brief pause in the stock’s strong uptrend during December.
UnitedHealth’s Chart Analysis
Recent Price Action and Technicals
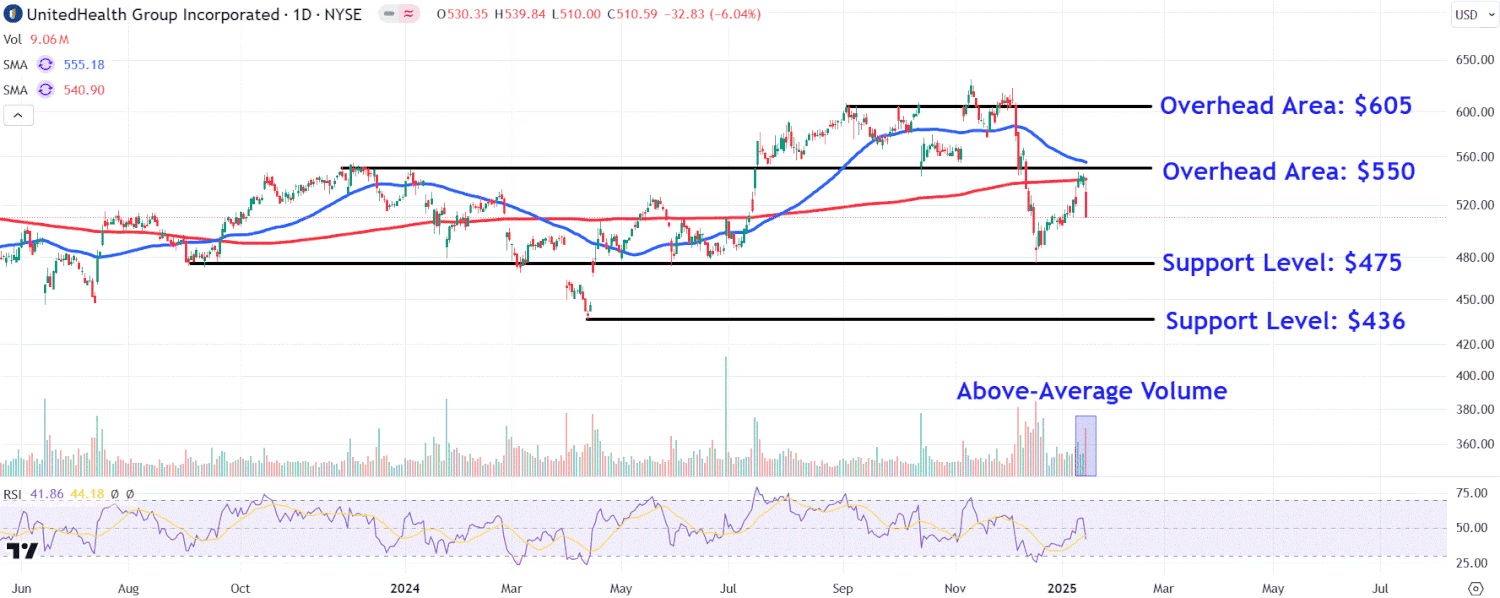
UnitedHealth shares tumbled Thursday after the health insurer reported fourth-quarter results below Wall Street’s expectations and issued a lackluster outlook amid higher medical costs.
The stock ran into selling pressure near the 200-day moving average, with today’s earnings-driven drop following several failed attempts by the bulls to close above the closely watched indicator.
Investors should watch key support levels on UnitedHealth’s chart around $475 and $436, while also monitoring important overhead areas near $550 and $605.
Key Support Levels to Monitor
The first lower level to watch sits around $475. This location could provide significant support near a multi-month trendline that connects multiple troughs on the chart between September 2023 and December last year.
A breakdown below this important technical level could see the shares fall to the $436 area, a region where investors may look for buying opportunities to accumulate shares near the prominent April 2024 low.
Important Overhead Areas to Watch
Upon a countertrend rally in the stock, investors should firstly watch the $550 level. Investors may consider locking in profits on a retest of this month’s high, which closely corresponds with a range of similar price points on the chart stretching back to November 2023.
A breakout above this key resistance level could see the shares climb to around $605, an area where they may encounter selling pressure near several peaks positioned just below the stock’s all-time high (ATH) in November last year.
Conclusion
The Apple Price Drop: What’s Next for Investors?
In a shocking turn of events, Apple’s stock suffered its biggest one-day drop since August, sending shockwaves throughout the investor community. As discussed in the article, the key points centered around the tech giant’s declining stock price, which plummeted to a 5% loss in a single trading day. This significant drop can be attributed to a combination of factors, including concerns over China’s economic slowdown, reduced iPhone sales, and increased competition in the tech industry. Furthermore, investors were also spooked by Apple’s reduced revenue guidance, which only added to the market’s apprehension.
The significance of this event cannot be overstated, as it has far-reaching implications for investors and market analysts alike. The Apple price drop serves as a stark reminder of the volatility inherent in the stock market and the importance of staying vigilant and adaptable in today’s fast-paced economic landscape. As market trends continue to shift, it is crucial for investors to remain informed and adjust their strategies accordingly. The future implications of this event are multifaceted, with potential consequences for Apple’s stock price, investor confidence, and the overall tech industry.

